News
Look Up Tables
11 November 2020
Article by James Zjalic (Verden Forensics) and Foclar
Problem
Due to the inherent issues caused by uncontrolled capture environments, the intensity values within a digital image can cause the colours to appear unnatural and not accurately representative of those within an environment. In most cases imagery could benefit from an adjustment to characteristics such as the brightness or contrast, or balancing of the histogram using operations such as normalisation or equalisation. Although there are nicely presented applications which make these operations simple, all utilise Look Up Tables [1] (or LUT’s) behind the scenes to make these changes, so by directly manipulating the LUT (or a representation of such as a plot), the greatest level of control and optimal results can be achieved.
Cause
The general causes of issues relating to poor representation of a scene by digital imagery have been covered in previous articles, so will not be covered here.
Theory
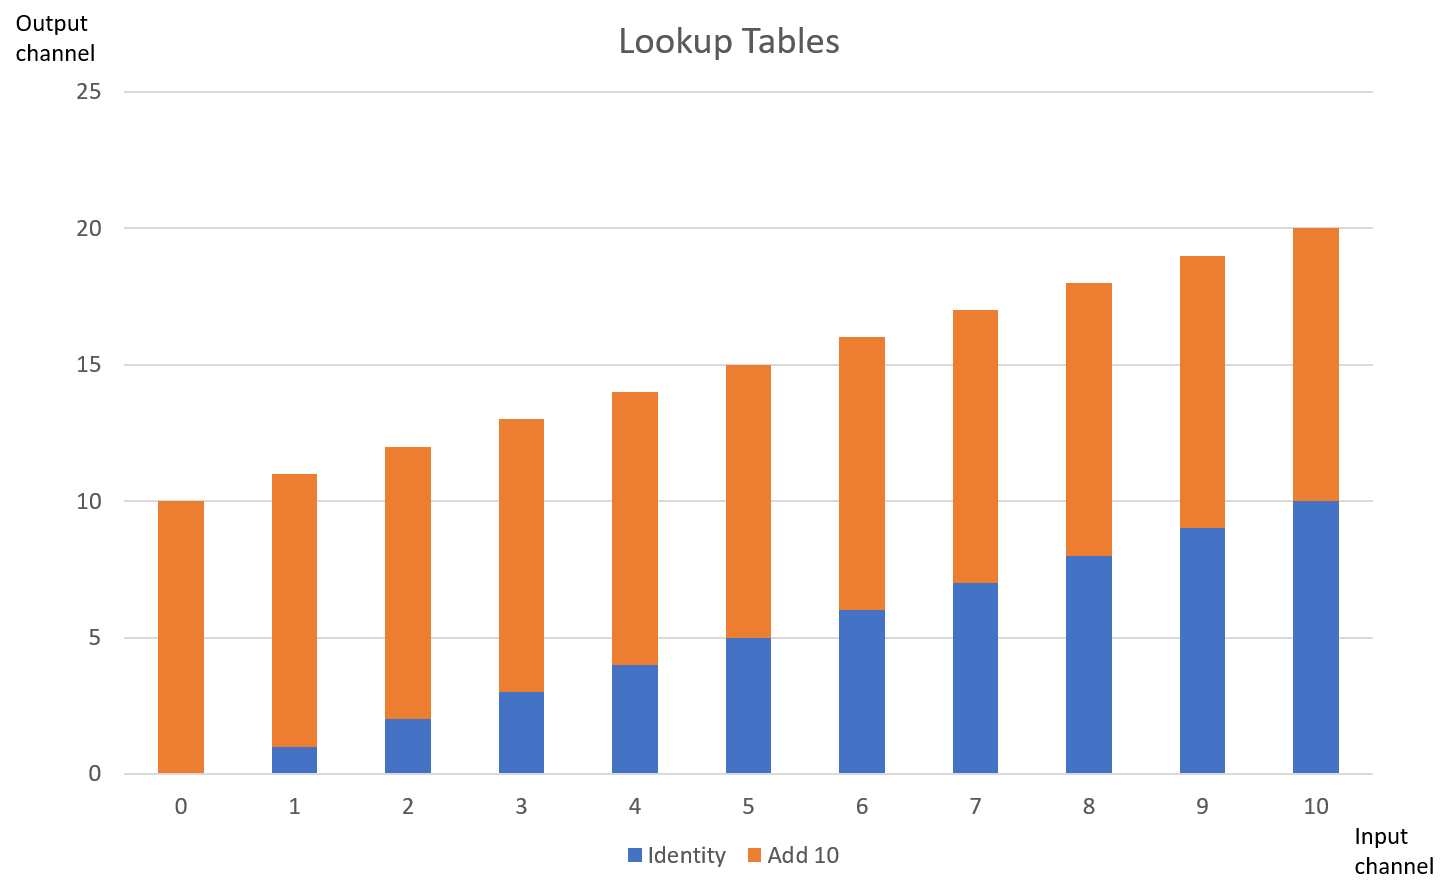
Look Up Tables are essentially tables containing the output result for each possible input, so in order to transform one input value to a predefined output value, the computer ‘looks up’ the tabulated result. For example, if one considers a grey-scale 8 bit image,, a brightness adjustment of 10 intensity values will result in a table that contains each possible input (from 0 – 255), with each output (the original input value plus 10). Rather than adding 10 to each input value independently, LUT’s are efficient as all values are already stored within the table (see Figure 1). LUT’s can be defined by their dimensionality, with the example being classed as 1-D as it takes one input and applies one operator to it (+10) to result in one output.
Although one dimensional LUT’s implementations are suitable for basic operators that can be represented by a single variable, such as brightness, gamma and contrast, not all parameters can be characterised by a single variable [2]. In these cases a 3-D LUT is more suitable, as they are more accurate and flexible, and are therefore used for applications such as colour space transforms. Due to the large number of coordinates required, 3-D implementations use interpolation to decrease the computational power required. For more information relating to such please visit the previous article on re-scaling.
As RGB images consist of three layers, three 1-D operators are used (one per channel) to achieve the best results [3].
Implementations
When performing LUT based operations on a grey-scale 8 bit image, the range of possible values is 0-255. For this type of image the number of entries in the LUT is therefore 256. In Impress, images used for filtering are represented by values which are double precision float. Each colour channel (red, green and blue) of a single pixel is therefore represented by a 64 bit number. This gives the opportunity for higher precision calculations when compared to 8 bit numbers as when multiple filters are used accumulative rounding errors can occur which can seriously deteriorate the final result. To limit the number of entries, the LUT is a 256 x 256 array for each colour channel and intermediate pixel values are calculated through interpolation.
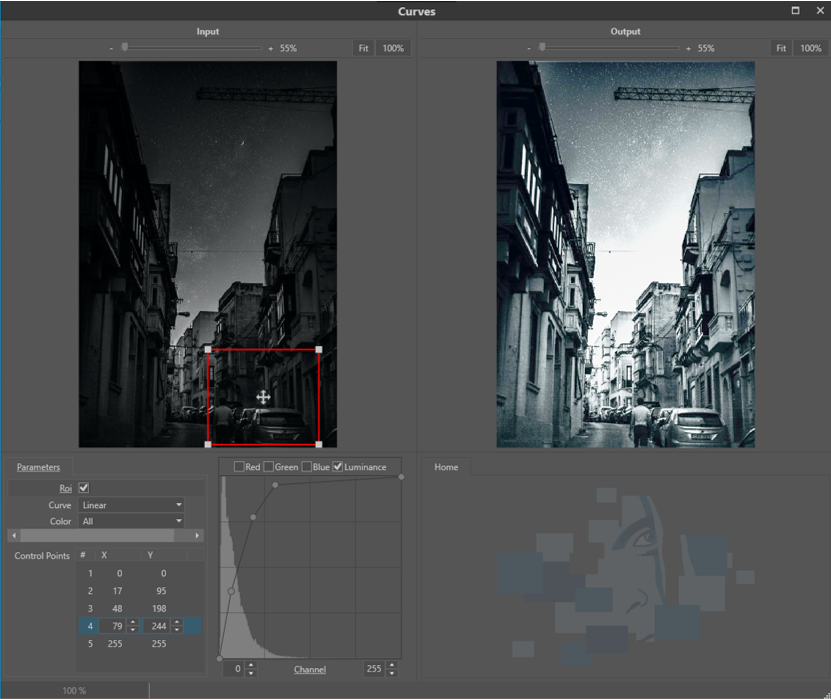
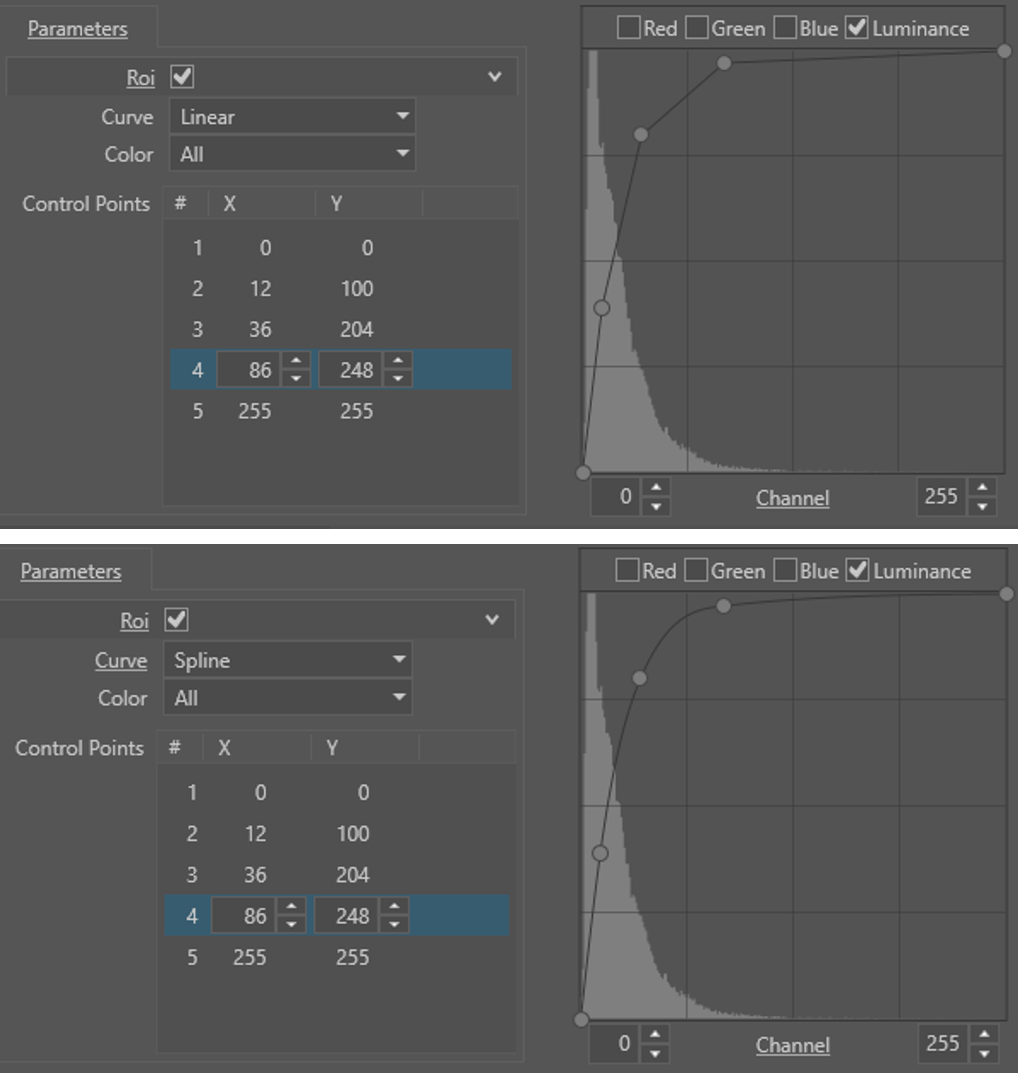
The options available within the Curves [4] filter in Impress are presented in the detail window of the filter shown in Figure 2. The window offers a side-by-side display of the input and output image of the filter and the histogram of the input image is also displayed. By switching on the region of interest inspector parameter ROI, the histogram shows only the levels inside the red rectangle. This option is very useful for images containing areas of different lighting. The current values inside the lookup table are plotted on top of the histogram. The shape of the plotted curve can be controlled by positioning the ‘control points’, and their positions can be changed by dragging the thumb in the graph or by changing in the listing on the left, which is convenient for reproducibility. The type of interpolation curves between the control points is controlled by the Curve parameter. The curves can be either a linear or spline interpolation (see Figure 3). The LUT based filters, e.g. Stretch, Equalize, Gamma and Curves all have the option to process the individual colour channels, allowing colour imbalance compensation in images (Color parameter) by adding three filters working on the individual colours.
Conclusion
Understanding the operations that take place behind the scenes when a brightness or contrast adjustment is made to digital imagery gives the user the opportunity to manipulate the Look Up Tables directly, thus providing greater control and operations that are highly specific to the image being processed that can lead to better overall results.
References
[1] Matt Pharr, “Chapter 24: Using Lookup Tables to Accelerate Color Transformations,” in GPU Gems 2, Nvidia, 2015.
[2] Mark Nixon and Alberto Aguardo, Feature Extraction & Image Processing. Newnes, 2002.
[3] Charles Poynton, Digital Video and HDTV: Algorithms and Interfaces. Elsevier, 2007.
[4] M. Sonka, V. Hlavac, R. Boyle, Image Processing, Analysis and Machine Vision p59, Brooks / Cole Publishing Company , 1999.
